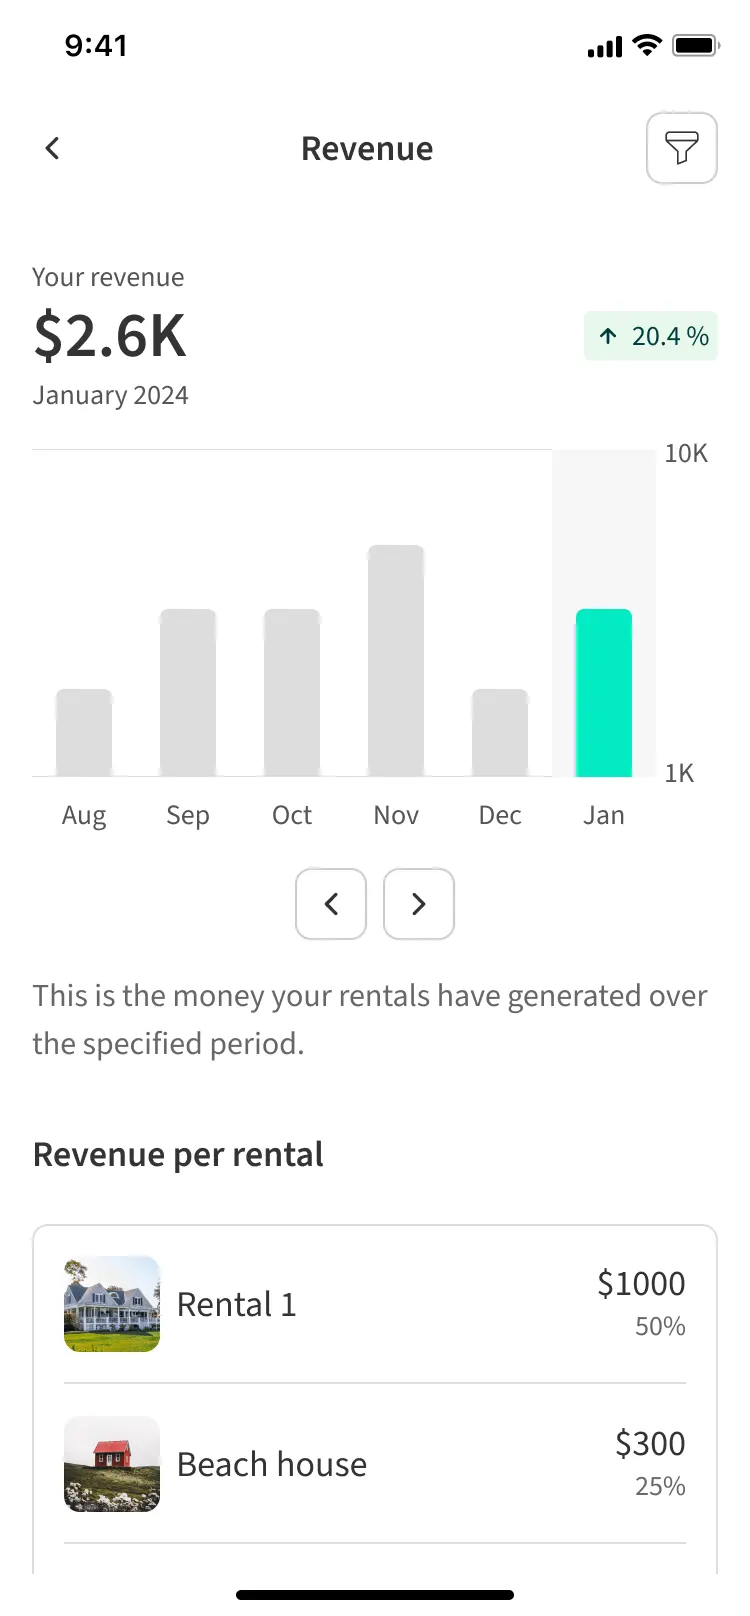
Design process
Who initiated the project?
The project was initiated by the product team in response to user feedback and strategic goals to enhance the mobile experience.
What problem or opportunity did they identify?
Property managers struggled to access business insights without a web interface. Identify occupancy gaps and optimise for upcoming vacancies. Perform seasonal trend analysis to inform strategic pricing decisions.
Why was this worth exploring?
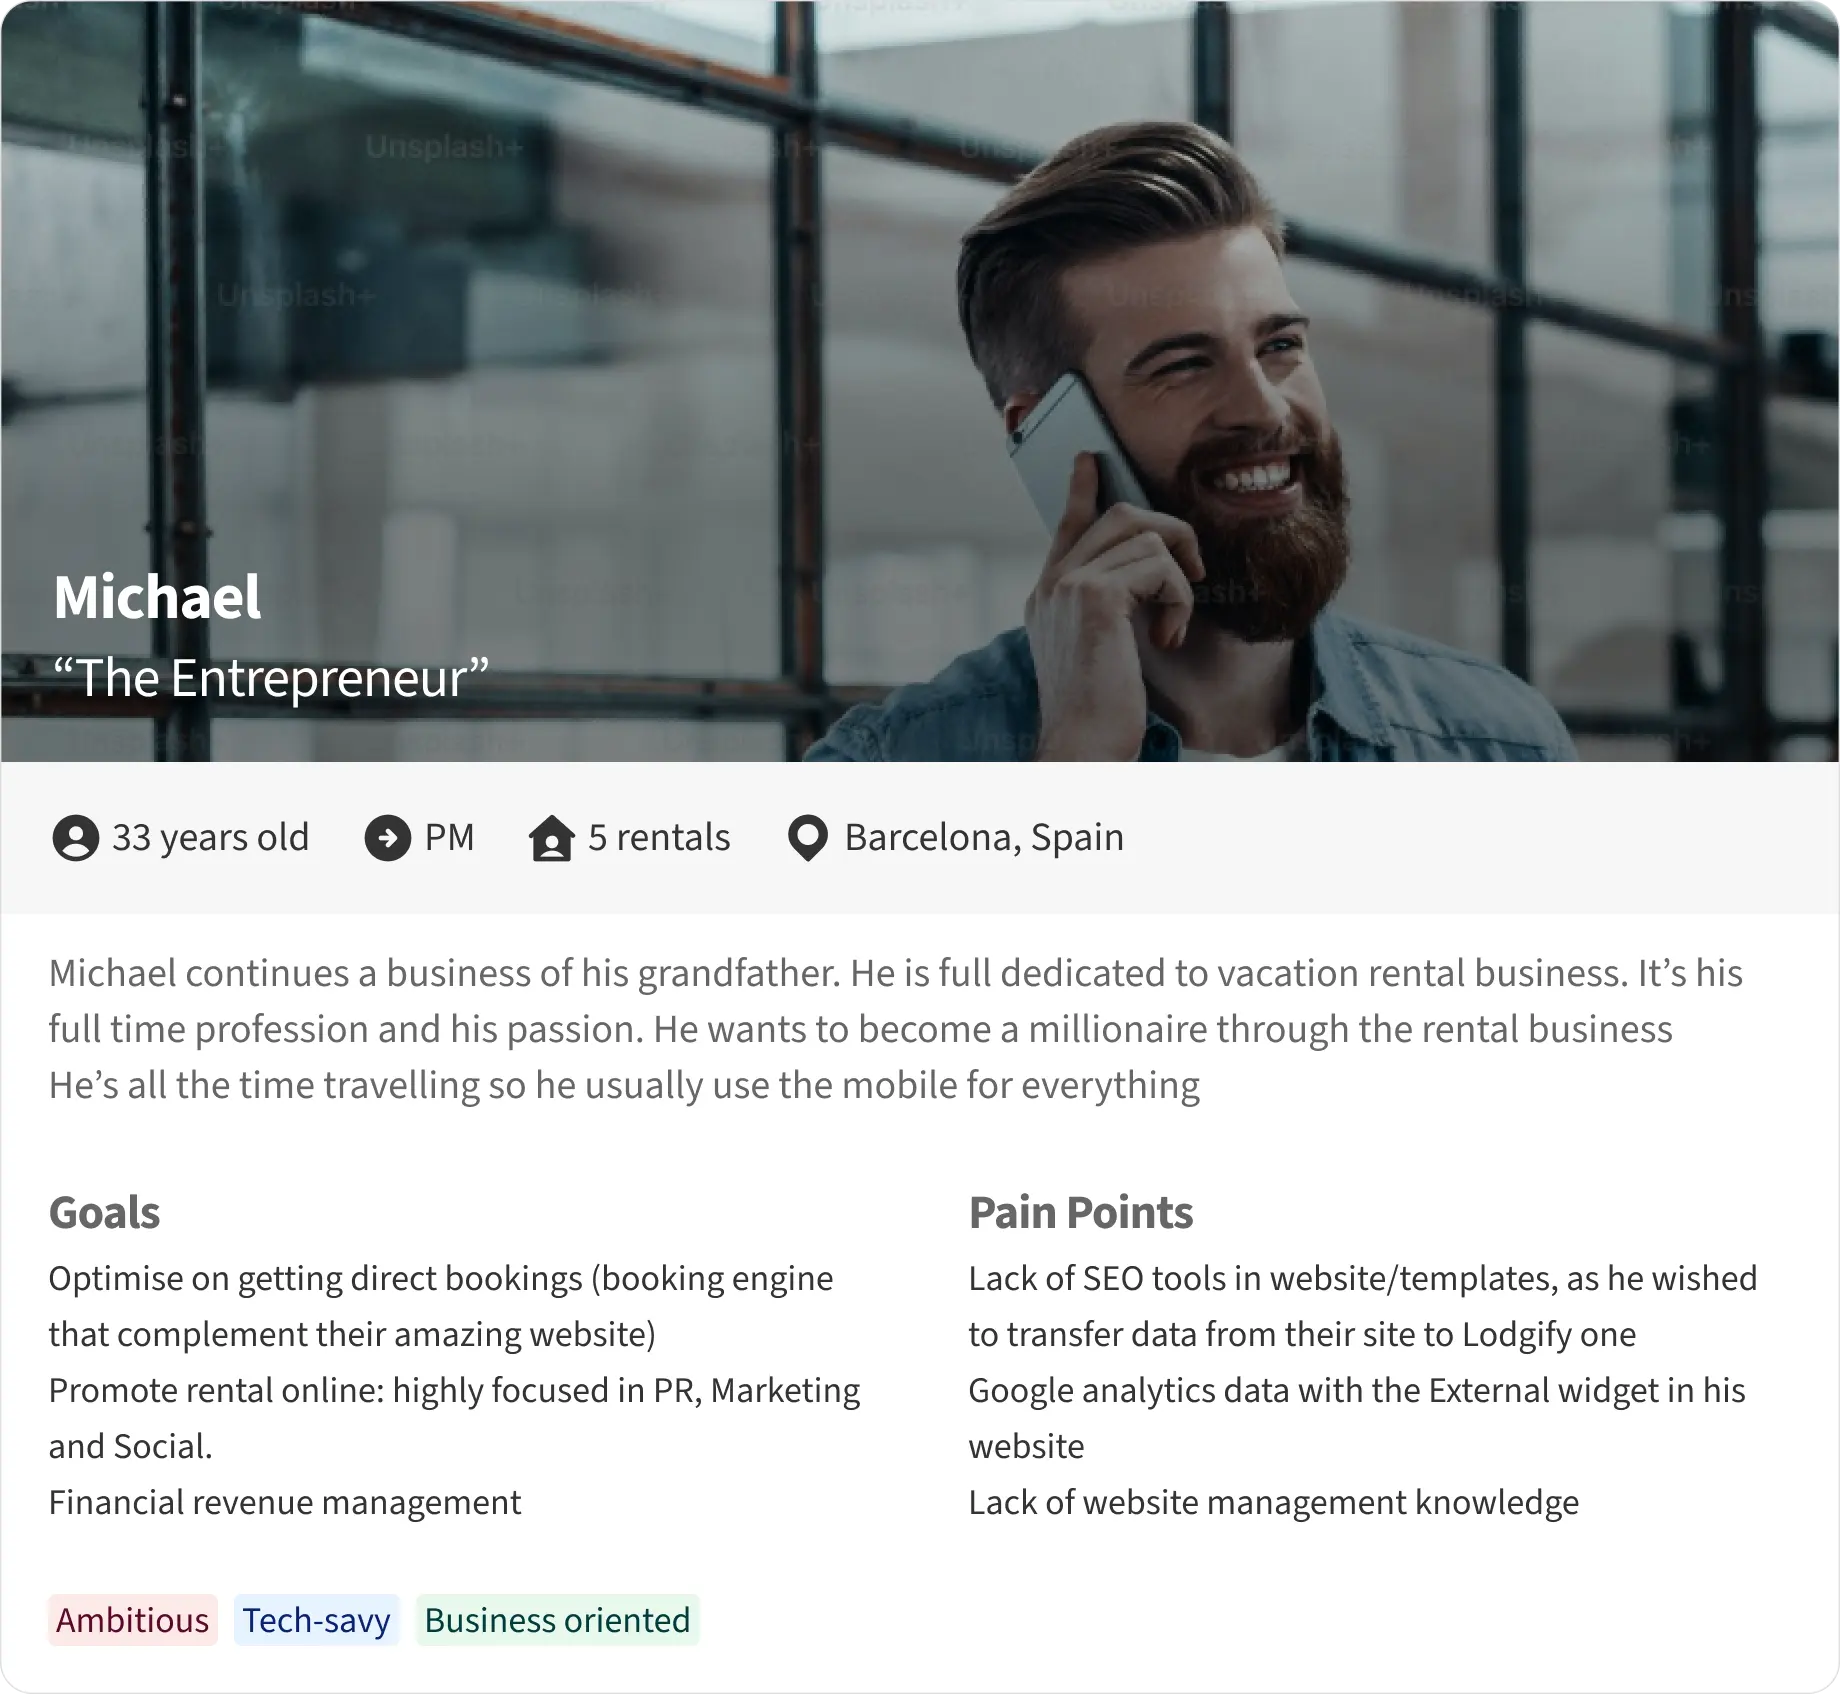
Mobile accessibility to detailed analytics would empower property managers like Michael (persona) to make informed decisions on the go, optimize business strategies, and improve overall operational efficiency.
The team: 1 PM, 3 Devs, 1 PD, 1UXR Timeline: Late 2024
Discovery
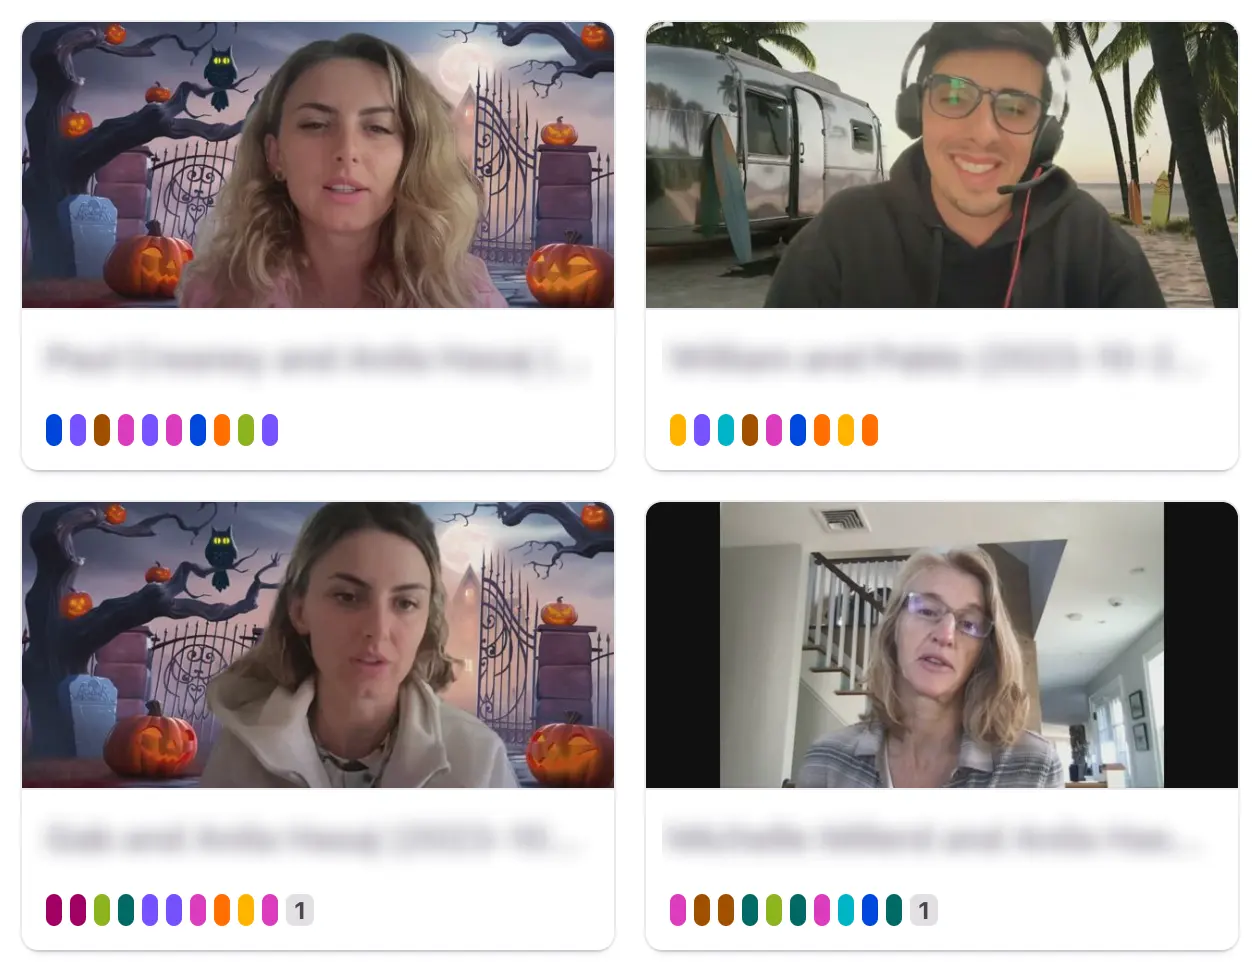
This phase was in collaboration with the UX researcher and the Product manager.
Research Methods
- Conducted user interviews to understand pain points.
- Analyzed user behavior to identify common gaps in mobile analytics.
- Reviewed existing web-based analytics features for reference.
Key Findings
- Users needed real-time access to revenue and occupancy data.
- There was a demand for tools to identify seasonal trends and booking patterns.
- Mobile analytics should enable quick actions, such as launching promotions.
Problem definition
This phase was in collaboration with the UX researcher and the Product manager.
- Michael needs real-time access to detailed revenue data for each property, including month-to-month comparisons, during transit.
- Michael needs insights into seasonal trends and booking patterns to plan for peak and off-peak seasons.
- Michael needs to identify occupancy gaps and launch promotions directly from the mobile app.
Ideation
Concepts, prototypes and hifi work.
What we did?
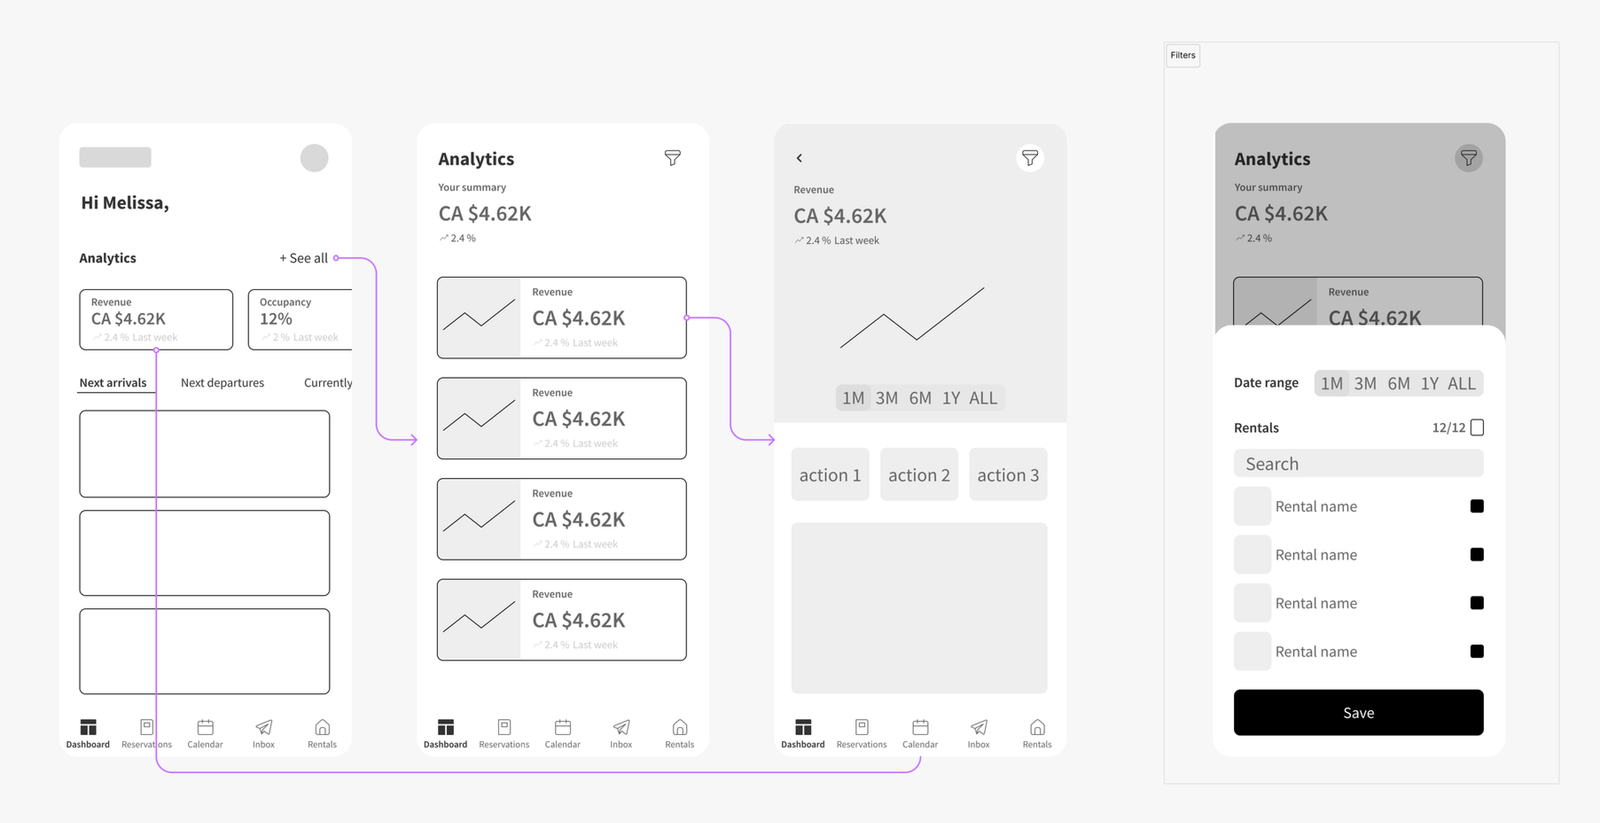
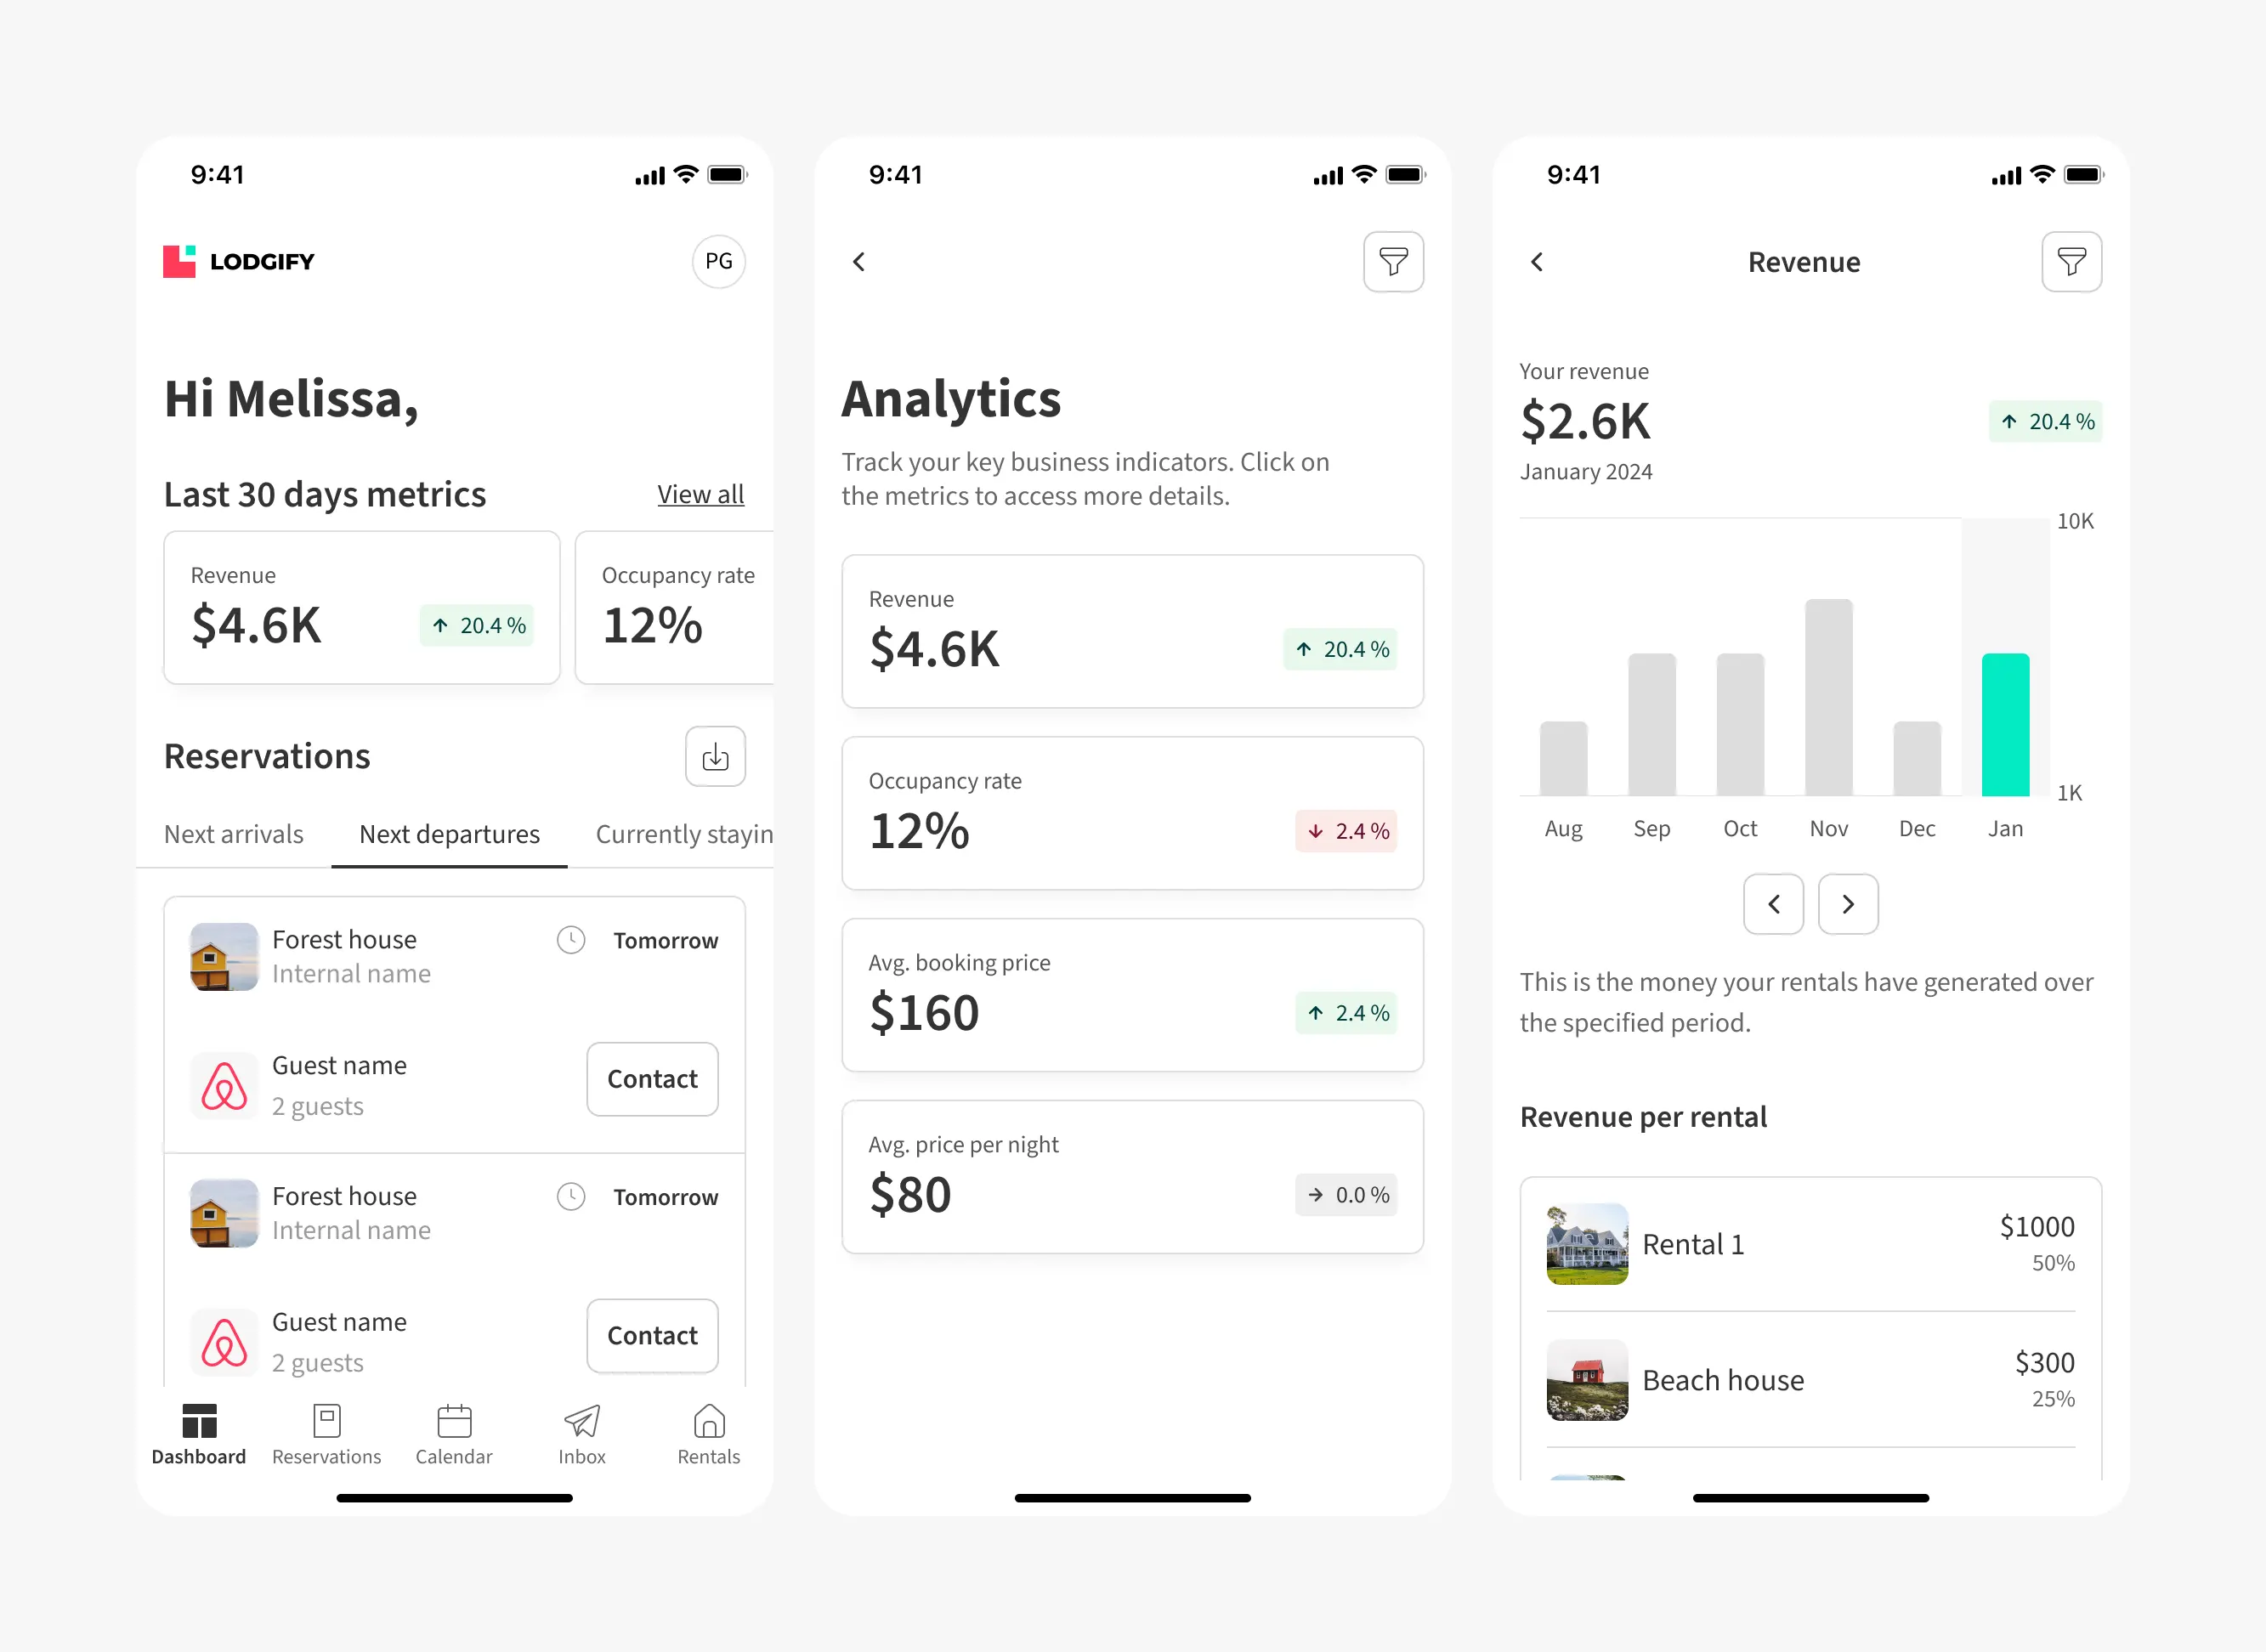
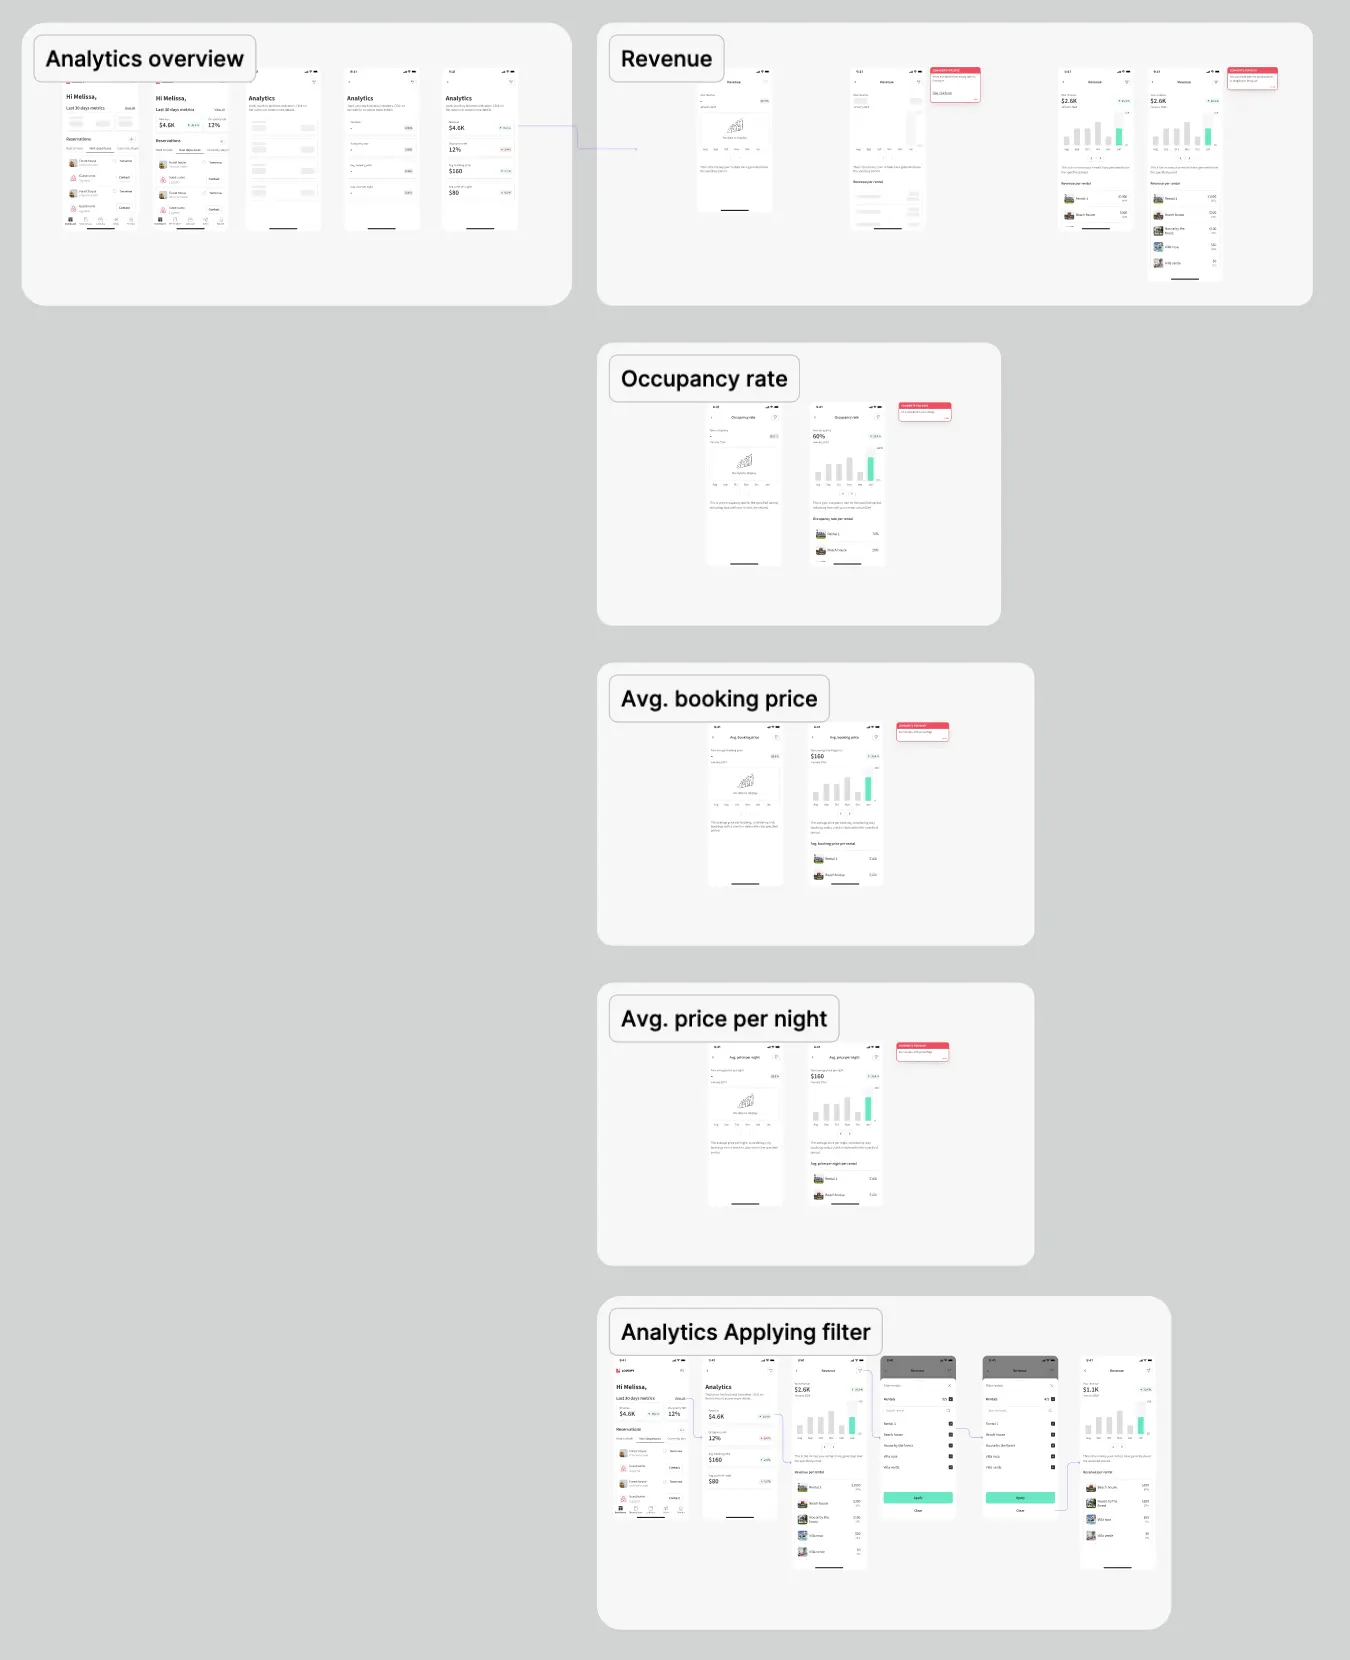
A mobile dashboard displaying 4 core KPIs (Revenue- Occupancy rate - Average price per night - Average price per booking. We wanted to include an Interactive breakdown screens for detailed KPI analysis and last but not least, filters and sorting functionality for custom views.
How we validated the idea?
Low-fidelity prototypes shared with stakeholders for feedback.
Regular syncs with the development team to align on feasibility.
Check one of the prototype of the project: See prototype
Launch and Results
Challenges
- Balancing feature richness with performance constraints on mobile.
- Ensuring seamless integration with existing PM Modules backend.
What was launched?
- Core KPI overview in the dashboard.
- Detailed breakdown screens for revenue, occupancy rate, average price per night, and average price per booking.
- Filter functionality for tailored views.
How was it received?
Positive feedback from users on the ease of accessing data and also there was an increased engagement with mobile analytics by 30%.